Activity dashboard and usage metrics
The Activity dashboard shows how you’re using Anuma — credits spent, requests made, token consumption, and usage broken down by model and tool. Use it to understand your usage patterns and manage your credits.
Steps
Step 1: Open Settings
Tap your profile icon or open the settings menu from the sidebar.
Step 2: Go to Activity
Select Activity from the settings panel.
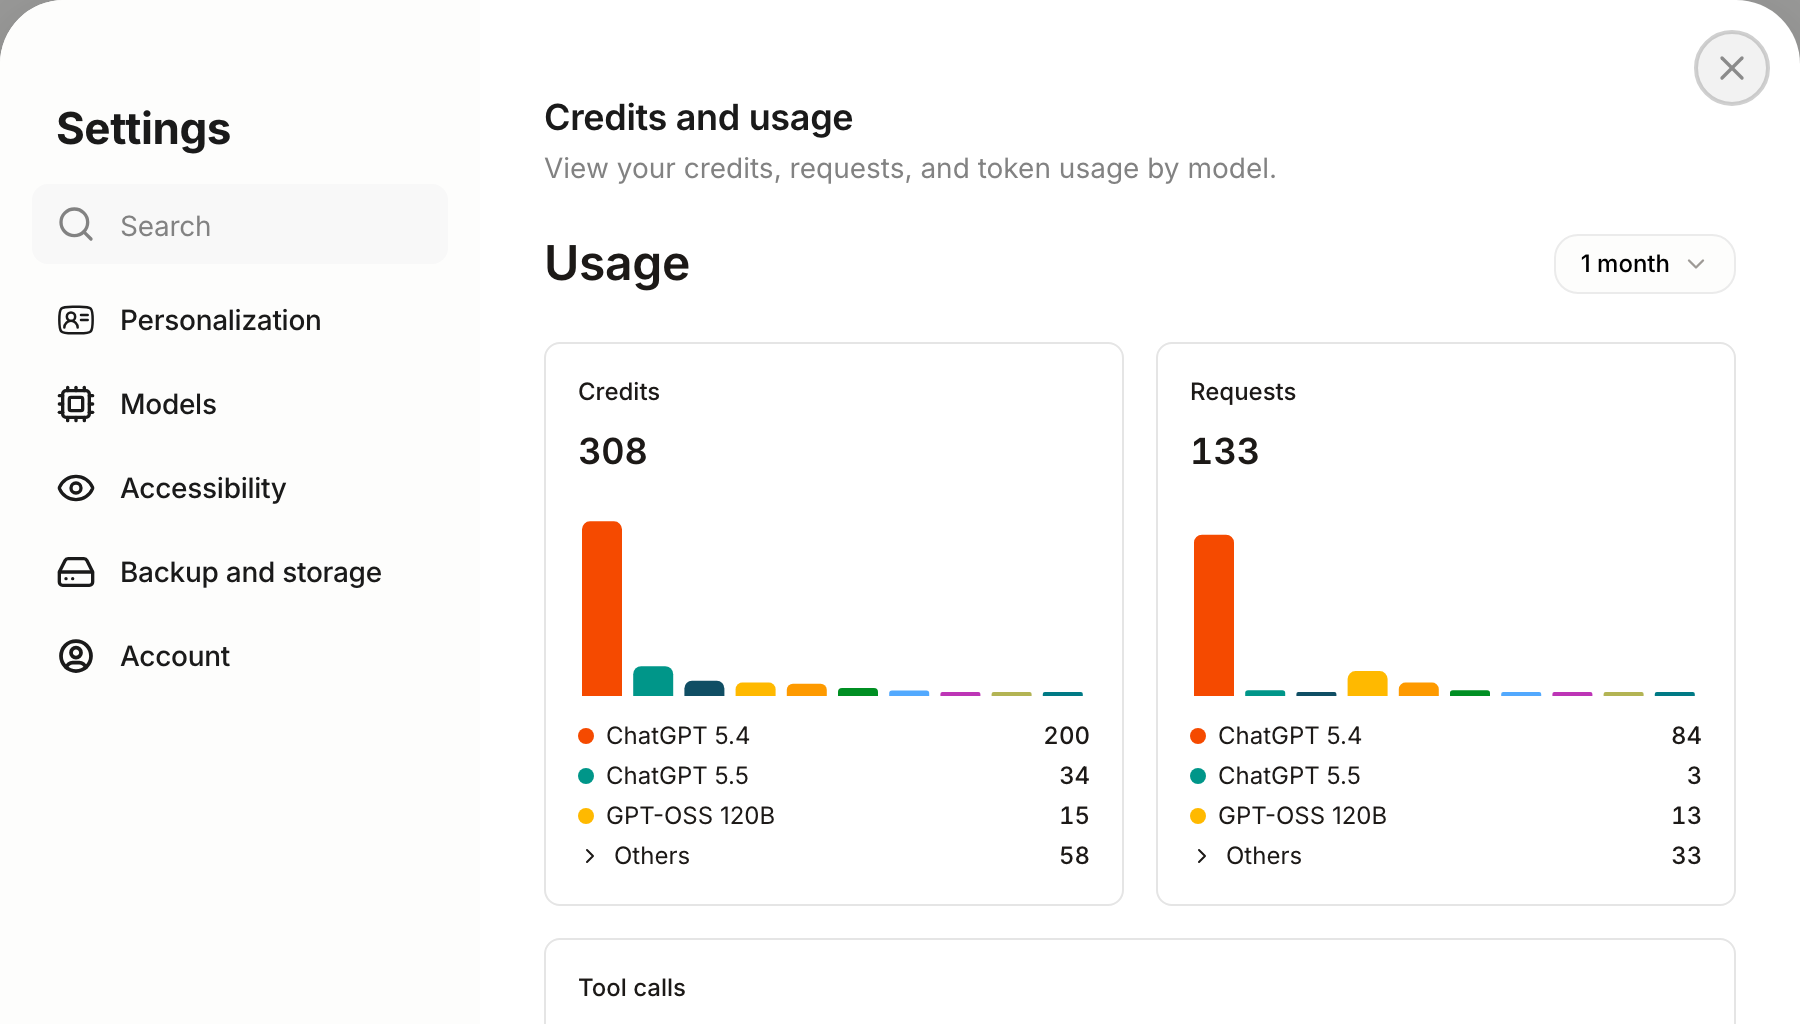
Step 3: Review your usage
The dashboard shows:
- Credits spent — Total credits used in the selected time period
- Requests made — Number of messages sent to each model
- Token consumption — Detailed token usage with bar charts
- Usage by model — Which models you’ve used most
Step 4: Filter by time period
Use the time filters (7 days, 30 days, etc.) to view usage over different periods.
Good to know
- The Activity dashboard updates in real-time as you use Anuma.
- Use it to identify which models consume the most credits and optimize your usage.
- Credits reset monthly — the dashboard shows usage for the current billing cycle.
- The dashboard is available on all plans. See plans .
Related articles
Last updated on